On 11/08/23 the Dow Jones Industrial Average (DJIA) 50 – day moving average (MA) was 39 – points away from crossing below its 200 -day MA. Today 11/09/23 the lines were only 18 – points apart. There’s a high probability the 50 – MA could go below the 200 – day MA on 11/10/23. The intersection known as a “Death Cross” could have signal a significant short-term move down for U.S. stocks.
The daily DJIA chart courtesy of BigCharts.com updates the action.

The DJIA began the session trading higher, then dramatically plunged lower. Daily Slow Stochastics had a bearish lines cross on 11/08/23. Todays move down pushed the lower line below 80% – the boundary of the overbought zone.
The SPX – 5 – minute chart courtesy of Trading View reveals a fascinating Elliott wave pattern.
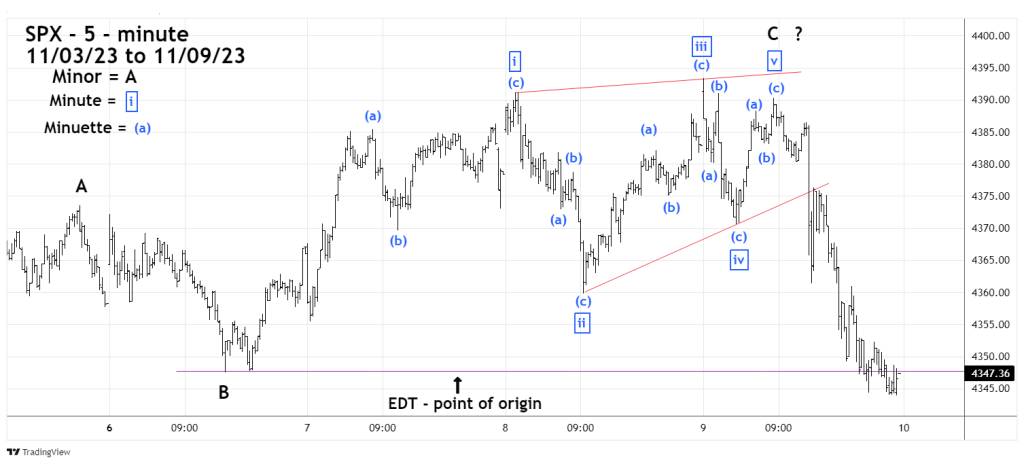
The SPX rally from 10/27/23 to 11/03/23 looks very much like a completed Elliott – five wave Impulse pattern. The SPX then had a shallow correction into the 11/06/23 low.
What came after the 11/06/23 bottom could be an Elliott wave – Ending Diagonal Triangle (EDT). This pattern only appears in the fifth wave position of motive patterns and in the wave “C” position of corrective waves. EDT’s are the termination phase of larger degree movements – in this case up.
EDT’s subdivide into five – waves each of which further subdivide into three wave patterns. Normally – about 90% of the time the fifth wave of an EDT will exceed the termination point of the third wave. It’s possible Minute wave “v” – boxed peaked today below the high of Minute wave “iii” – boxed, which is called a Truncated fifth wave. Rising EDT’s are one of the most bearish Elliott wave configurations. Rising Truncated fifth waves imply increased bearishness.
A rising EDT with a Truncated fifth wave is a very bearish signal.
After a rising EDT completes, it normally crashes down to its point of origin, which in this case is the 11/06/23 bottom.
If the DJIA has a “Death Cross” on 11/10/23 it could be the most significant signal of 2023.
