The prior blog noted that in 2022 the Dow Jones Industrial Average (DJI) had a “Death Cross” on the same day a secondary bottom formed.
The daily DJI chart courtesy of Trading View shows that “Death Cross”.
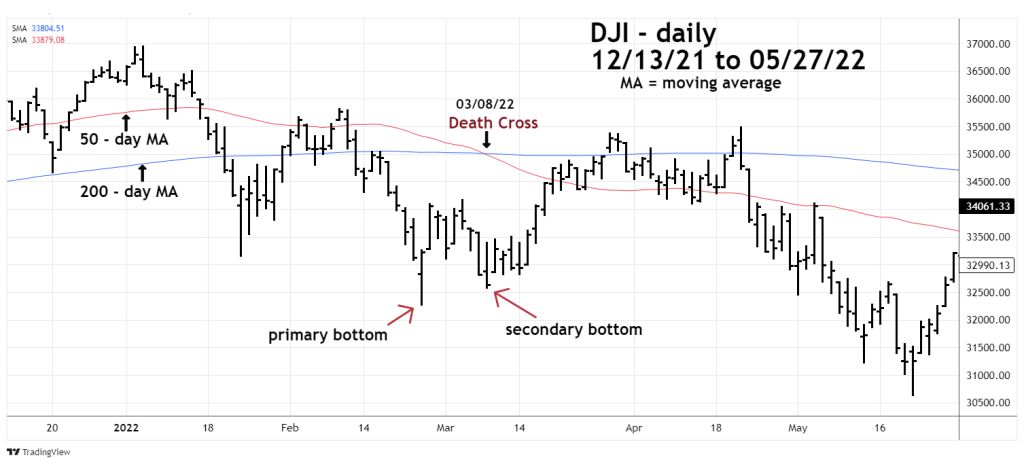
The same phenomenon could happen in the next week. Watch the DJI – 50 – day and 200 – day moving averages. If there’s a cross it could identify a secondary bottom above the DJI 10/27/23 bottom.
