The Dow Jones Industrial Average (DJI) could soon have an important “Death Cross” (DC) signal.
When the 50 – day Moving Average (MA) line crosses beneath the 200 – day – MA it’s called a Death Cross – bearish signal. When the 50 – day – MA crosses above the 200 – day – MA it’s called a Golden Cross – bullish signal.
Because stocks generally fall faster than they rally, “Golden Cross” signals are very effective signaling bull moves lasting several months.
“Death Crosses” usually indicate a significant bottom could occur within one to two weeks.
Please see the 03/12/22 blog “The Infamous Death Cross” which illustrated the S&P 500 (SPX) Death Cross signals from 2015 to 2020.
Todays blog examines both SPX and DJI – DC signals from 2015 to 2022.
The daily DJI chart courtesy of Trading View which shows its action from 2022 to 2023.
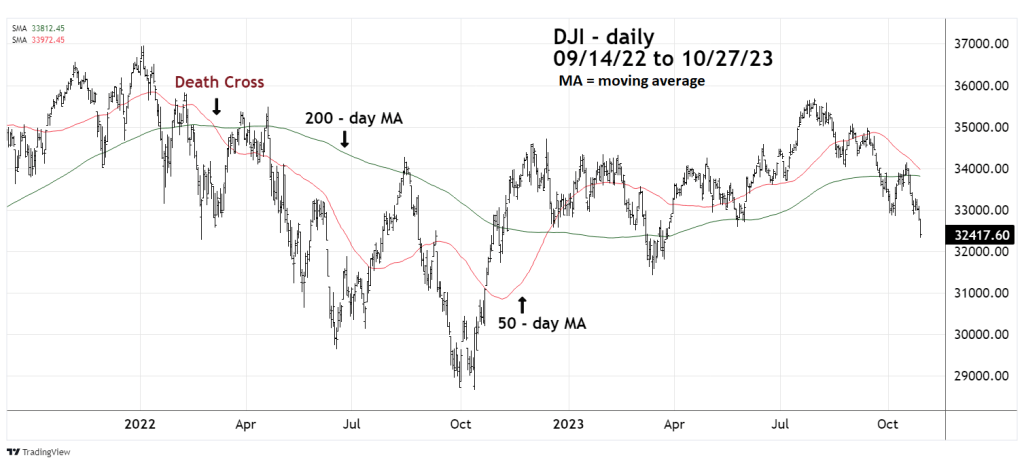
It appears the DJI could very soon have its first “Death Cross” signal since March 2022.
The daily SPX chart illustrates its activity from 2022 to 2023.

The SPX moving average lines are further apart, in the current cycle the DJI is taking the lead.
The next daily DJI chart shows DC signals from 2015 and 2016.

On 08/11/15 the DJI was the first to have a DC signal. 9 – trading days later on 08/24/15 a significant bottom was made. Subsequently U.S. stocks rallied for two months.
The SPX – DC signal came on 08/28/15 – 4 – trading days after the bottom.
The next DC signal happened on 01/08/16. This time the SPX was the leading index. The DJI – DC signal happened on 01/13/16, 4 – trading days later on 01/20/15 a bottom occurred. A month later both indices made double bottoms that were the prelude to a 2 – year bull market.
The next daily DJI chart illustrates DC signals made in December 2018.

In this cycle the SPX was again the leading index with a DC signal on 12/07/18. 11 – trading days later a significant bottom was in place. The DJI – DC signal occurred on 12/19/18 – 3 trading days before the bottom. The next bull phase lasted just over 1 – year.
The daily DJI chart 2019 to 2020 shows what happened during the 2020 crash.

On 03/20/20 the DJI had a DC signal, the crash bottom was made 1 trading day later. The SPX had a DC signal on 03/27/20 – 4 – trading days after the bottom.
Please refer back to the DJI and SPX – 2022 to 2023 daily charts.
The DC signals that occurred in March 2022 gave warnings of a larger developing bear market.
The DJI 03/08/22 DC signal occurred at a secondary bottom. The DJI then rallied to 04/21/22 and subsequently declined to a bottom on 06/17/22.
The SPX – DC signal was on 03/14/22 at a tertiary bottom; it then rallied to 03/29/22 before declining to a bottom on 06/17/22.
The record of DC since 2015 indicates an important stock market bottom could be made within 1 to 11 trading days after signal.
If in the next few trading days there’s a DJI “Death Cross”, it could help discover an important bottom.
