Seasonal stock patterns are bearish until late October. Today’s U.S. – FOMC short – term interest rate announcement triggered additional selling, opening the door for lower prices.
The daily S&P 500 (SPX) chart courtesy of Trading View shows two potential support zones.
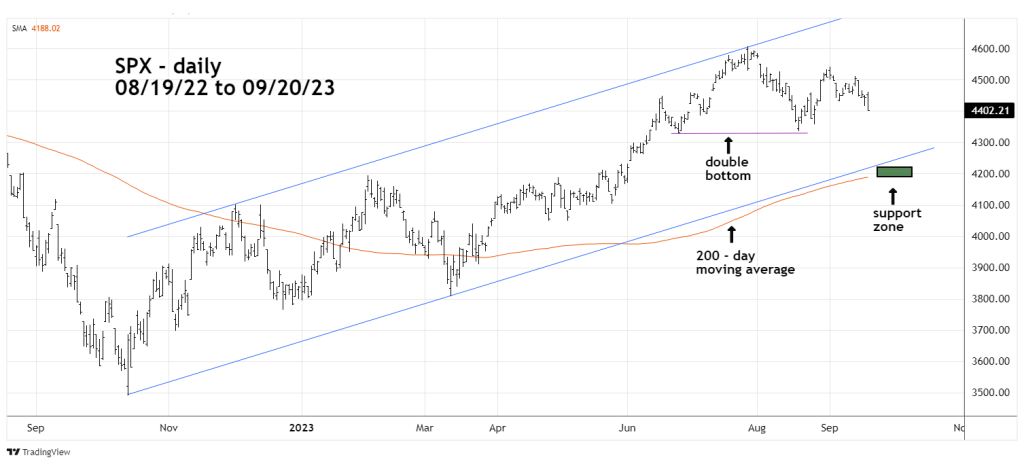
The first support area is the double bottoms of 06/26/23 and 08/18/23. The important level is 4,328.08 made on 06/26/23, a break of this low opens the door for a move down to at least the low 4,200 area.
Durning the next two – weeks, the rising trendline and the 200 – day moving average will be in the low 4,200 zone. This is a logical place for the bulls to start a counter offensive.
Most and perhaps all U.S. stock fund managers measure their performance relative to the SPX. The 200 – moving average line is probably the most watched technical indicator.
Durning the next five weeks, if the SPX decisively breaks below its 200 – day moving average – it could trigger a mini – crash to the October 2022 bottom.
