The 09/12/23 blog noted “The SPX since its 07/27/23 top could be forming a series of “one’s” and “two’s” down”. This is still the most likely Elliott wave count, however the second wave “two” – up of the series may still be under development.
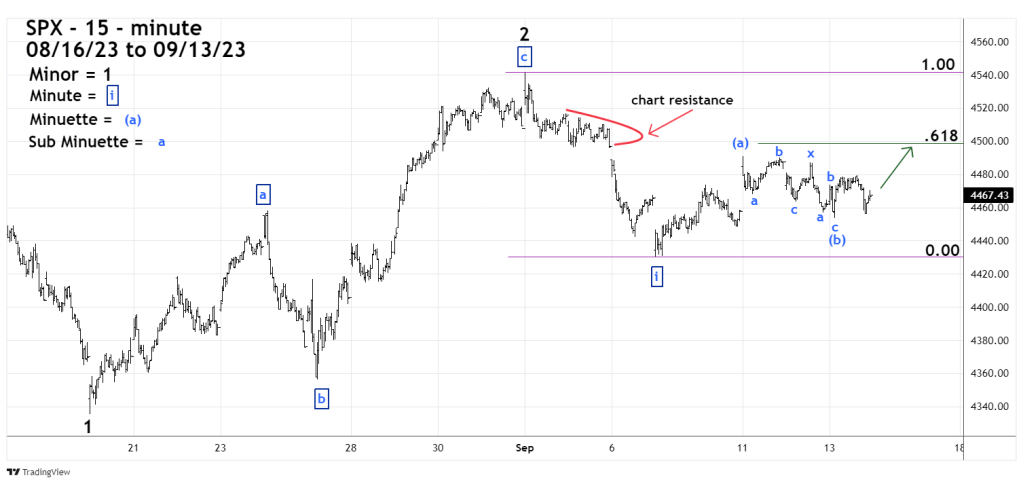
The 15-minute S&P 500 (SPX) chart courtesy of Trading View updates the action.
The release of the U.S. monthly CPI report on 09/13/23 could have triggered are sharp decline. It did not and the SPX only went marginally below the bottom it made on 09/12/23.
The shallow and choppy decline from the SPX 09/11/23 top at 4,490.77 labeled Minuette wave (a) counts best as an Elliott wave “Double Zigzag”.
The SPX bottom today 09/13/23 at 4,453.52 labeled Minuette wave (b), appears to be the termination point of the “Double Zigzag”.
The subsequent rally could be Minuette wave (c) of Minute wave “ii” – boxed. The target zone for the end of this wave is in the low 4,500 area.
If the SPX reaches this target zone it could be a very important peak just prior to a large multi-week decline.
