The S&P 500 (SPX) could be developing a very bearish Elliott wave count.
The hourly SPX chart courtesy of Trading View updates the action.
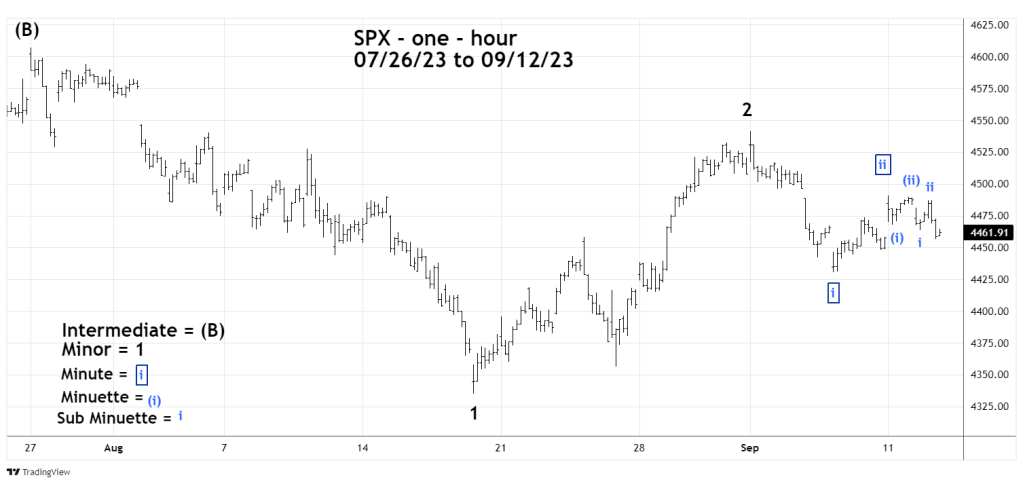
The SPX since its 07/27/23 top could be forming a series of “one’s” and “two’s” down.
Minor waves “1”- “2” and Minute wave “I” – “ii” are main portions of the pattern.
Minuette waves (i) – (ii) and Sub Minuette waves ‘I” – “ii” represent what could be a developing Minute wave “iii” down.
The series of “one’s” and “two’s” is the most dynamic Elliott wave configuration. They are followed by “third” of a “third” waves which are usually very powerful in the direction of main trend. In this case its down.
The U.S. monthly CPI report is due at 8:30 AM – EDT 09/13/23.
