Currently the most important factor for U.S. stocks is the dimension of time.
In Technical analysis of markets and stocks a great deal of attention is focused on price patterns. Some attention examines momentum, and usually only a small amount of attention deals with time.
The time dimension involves examining how long price rise/fall, cycles of bottoms/tops, and seasonal trends.
Almost all markets have seasonal tendencies. Seasonally stocks are bullish from November to April and bearish from May to October. September is a particularly bearish month. According to “Stock Trader’s Almanac” Since 1950 – September has been the biggest percentage loser for both the S&P 500 (SPX) and Dow Jones Industrial Average (DJI).
Most of the time the main U.S. stock indices are in steady declines as they enter September. There are two historical exceptions where there were rallies into early September prior to significant declines.
The first example is illustrated in the daily DJI chart courtesy of Trading View.
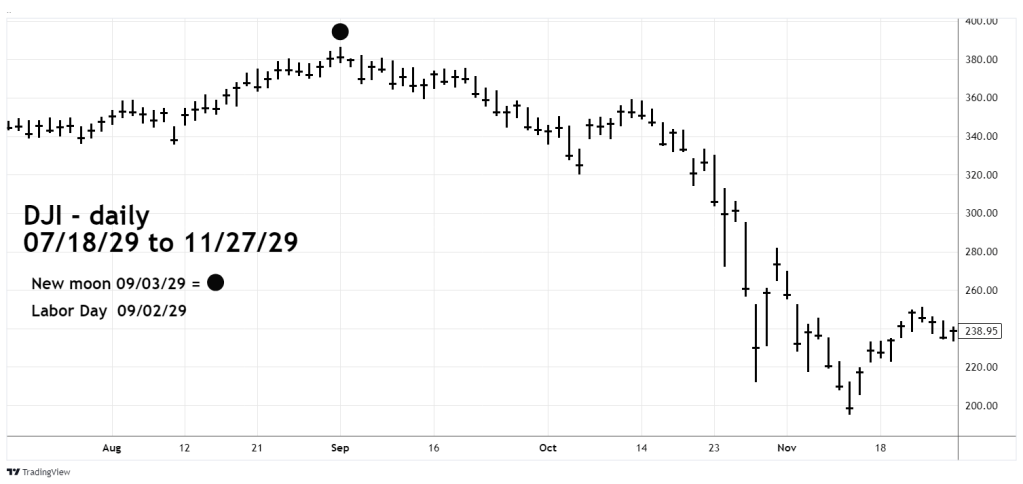
The major DJI bull market top in 1929 occurred on 09/03/29 which was the day of a New moon. Occasionally markets make turns plus or minus two trading of a New or Full moon. In this case it was a bulls eye hit. The peak also occurred a day after the U.S. Labor Day – holiday.
The daily SPX chart examines the secondary peak made in September 2000.
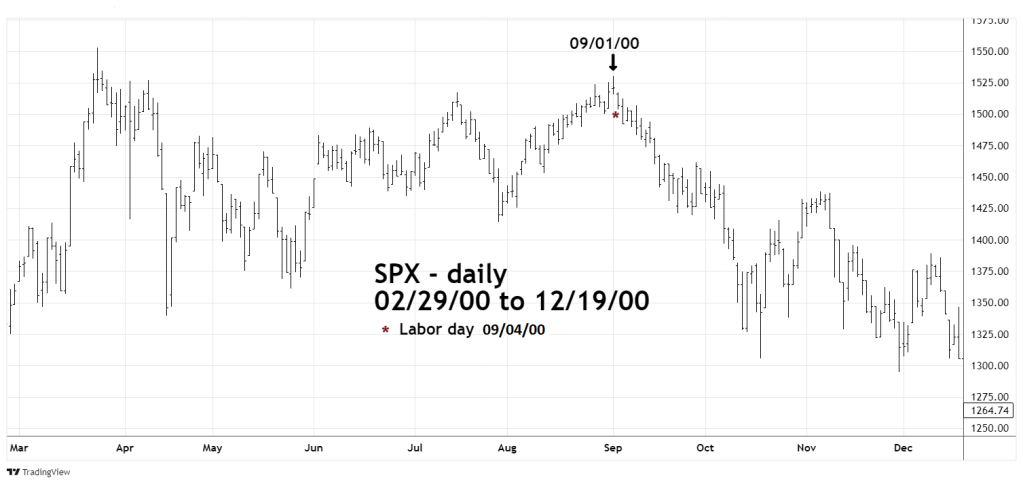
The ultimate SPX bull market top happened in March 2000. After a sharp drop it slowly retraced most of the decline making a secondary peak on Friday September 1, 2000. Monday September 4, 2000 was Labor day. The next day was the start of a significant bear trend.
The next daily SPX chart examines its action from late 2021 to the present.
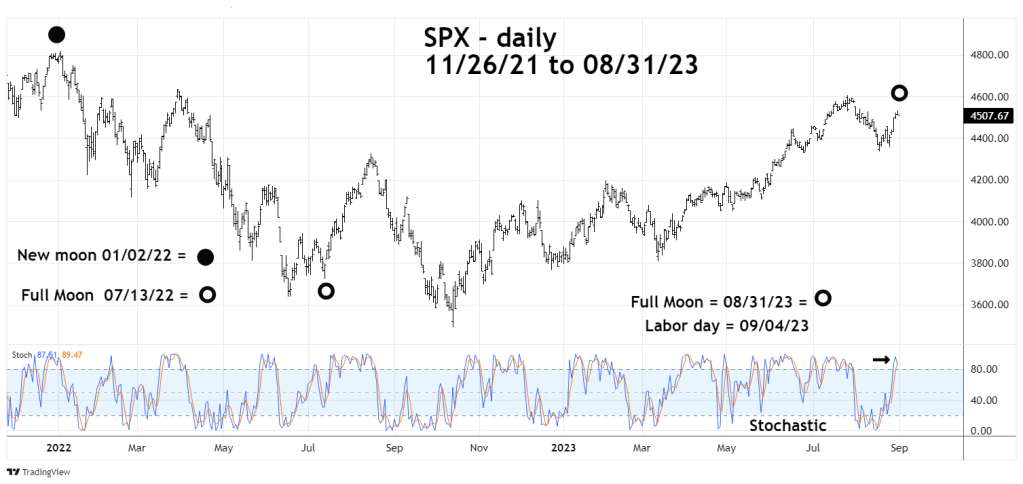
There was a New moon on Sunday January 2, 2022, the SPX peaked on January 4, 2022. On July 13, 2022 there was a Full moon. The SPX made an intermediate bottom on July 14th.
Today 08/31/23 there’s a Full moon. The U.S. monthly payroll report is due at 8:30 AM – EDT – 09/01/23. Labor day is 09/04/23. Daily SPX – Stochastic is in the overbought zone.
U.S. Stocks may have made an important top on 08/31/23. If not, a top could occur in the next two trading days.
