On 8/18/23 the Nasdaq Composite (IXIC) bottomed out after its post 07/19/23 decline. The rally after the 08/18/23 bottom could still be a fourth wave of a developing motive pattern. However, the size of the rally is suspiciously large for a presumed wave “four”.
This current blog examines two other potential Elliott wave counts.
The IXIC two – hour chart courtesy of Trading View illustrates the most likely of the two wave counts.
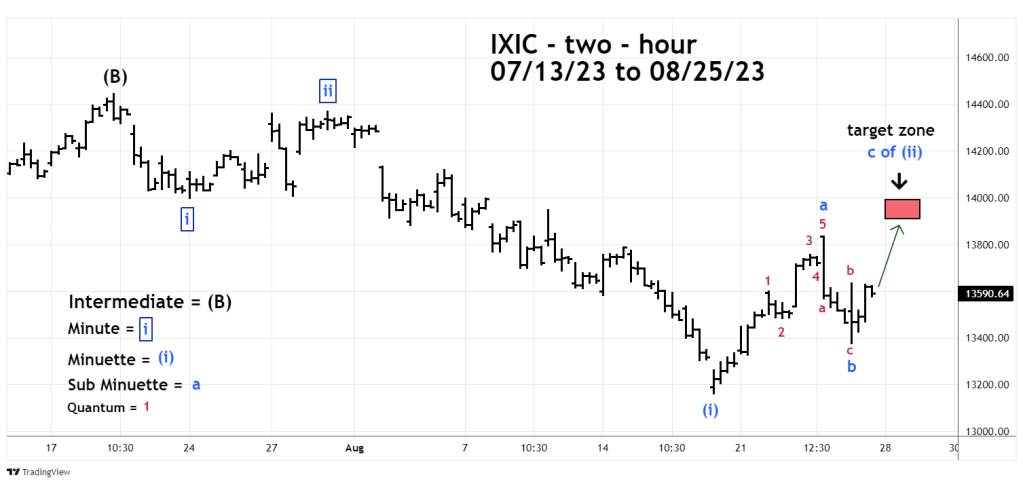
The prior blog “Bearish Stock Reversal – 08/24/23” illustrated the bearish internal momentum of the NYSE. This evidence implies that the rally after the 08/18/23 bottom is just a bounce in a larger developing down trend. If so the post 08/18/23 rally could be the second wave “two” of a developing extended Elliott – Impulse wave. In bear trends the subsequent action after a second wave “two” is usually a deep and sharp decline.
There’s a good chance the post 08/18/23 rally could still be developing. The 08/18/23 to 08/24/23 rally was an Elliott – Impulse wave labeled Sub Minuette “a”. The 08/24/23 to 08/25/23 decline was a three-wave corrective pattern. This movement suggests a rally on or after 08/28/23 into the 13,900 to 13,980 zone. A Fibonacci .618 retracement of the 07/19/23 to 08/18/23 decline is at 13,955.
The next two – hour IXIC chart shows an alternate bullish wave count.
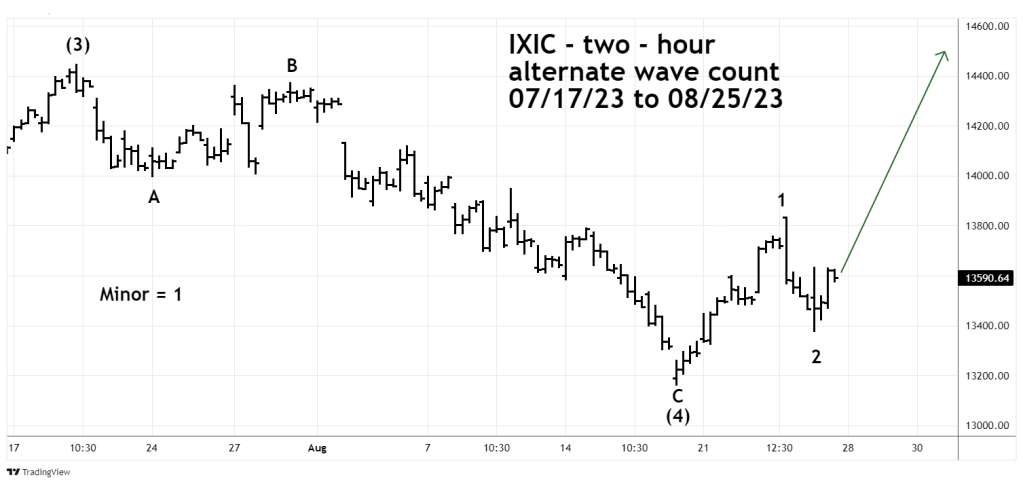
For every bearish Elliott wave count there’s always an alternate bullish wave count. If this wave count is correct it implies the IXIC could rally to a new 2023 high. Bearish internal momentum makes this wave count a low probability. Low probability does not mean no probability.
