Today 8/24/23 the S&P 500 (SPX) opened the session with a gap up. The opening move invalidated the Elliott wave count illustrated in this websites prior blog. It appeared this open could be the beginning of a day long bull run. What happened was a dramatic bearish reversal. The SPX declined into the close of the session and wiped out all of the upside action of the prior two trading days!
The early SPX move up invalidated the prime Elliott wave count and opened the door for several alternate Elliott wave counts. One alternate count is an SPX moves above the 07/27/23 peak. The probabilities of an SPX move to new near -term 2023 high is very low. Why? The short – term internal momentum of U.S. stocks has been very bearish.
The daily NYSE- Advance/Decline line chart ($NYAD) courtesy of StockCharts.com illustrates its upside progress during the most recent rally.
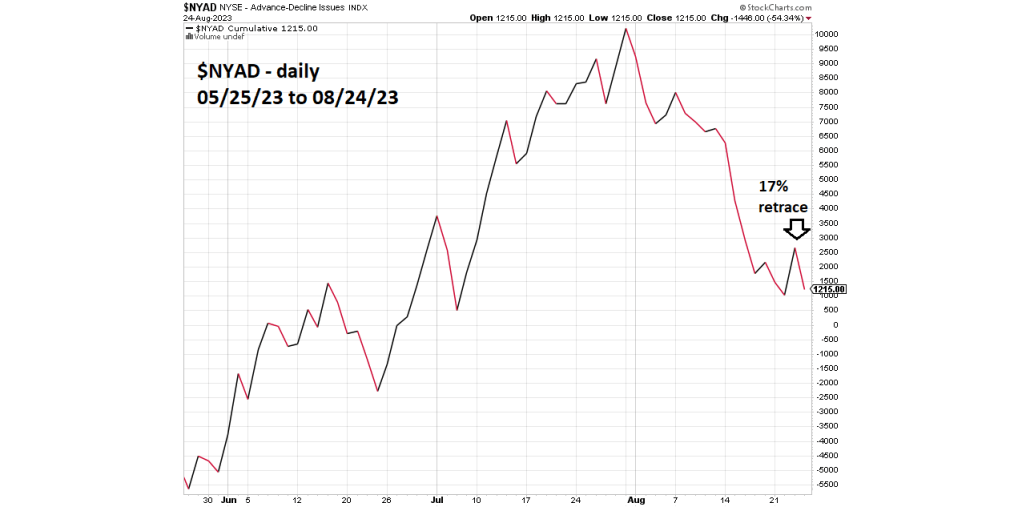
At the 8/24/23 high the SPX had retraced 45% of its downside progress since late July. As of 08/23/23 the $NYAD had retraced only 17% of its drop from late July. On 08/24/23 – 23% of NYSE stocks advanced vs. 75% declining stocks.
The very bearish A/D line strongly implies more downside action for U.S. stocks.
On 08/24/23 the Nasdaq Composite moved above its 08/23/23 high. The Elliott wave count illustrating an Elliott fourth wave is still valid. However, the size of the rally is suspiciously large for a presumed Minute wave “iv”.
One possible alternate wave count has the 08/18/23 to 08/24/23 as a second wave two – up, correcting the downside progress since the Nasdaq Composite July peak. This wave count is very bearish and implies a sharp drop could be developing. Updates to the Nasdaq Composite – Elliott wave count could be illustrated soon.
The 08/19/23 blog “S&P 500 First Wave Down Nearing Completion – 08/18/23” noted that a short – term low could be made near 4,300. The very bearish internal momentum implies the SPX may not find support at 4,300.
