The post 08/18/23 rally in U.S. stock indices could be complete.
The 08/19/23 blog “S&P 500 First Wave Down Nearly Complete – 08/18/23” illustrated that the S&P 500 (SPX) may have completed Minuette wave (iv) of Minute wave “v” – boxed of the post 07/27/23 decline.
The 30 – minute SPX chart courtesy of Trading View updates the action.
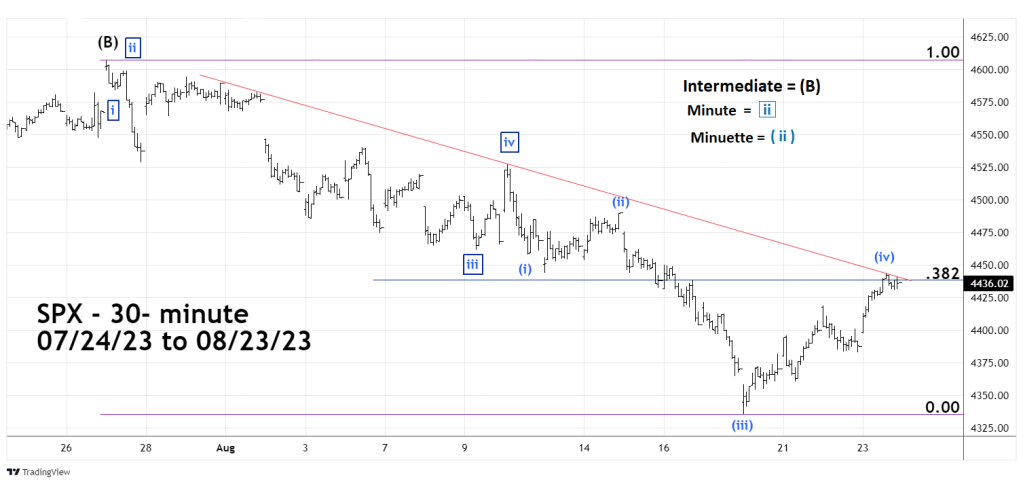
The rally has continued and as of 08/23/23 reached just below the maximum level for a fourth wave of an Elliott Impulse pattern. If the rally continues into the area of Minuette wave ( i ) it would invalidate the presumed Impulse pattern. If this were to occur it opens the door for other wave counts.
The SPX high on 08/23/23 was just above a Fibonacci .382 retracement of the 07/27/23 to 08/18/23 decline and hit a multi – day declining trendline. These two factors imply a short-term peak may have been made.
The 30 -minute Nasdaq Composite (IXIC) illustrates its short-term Elliott wave count.
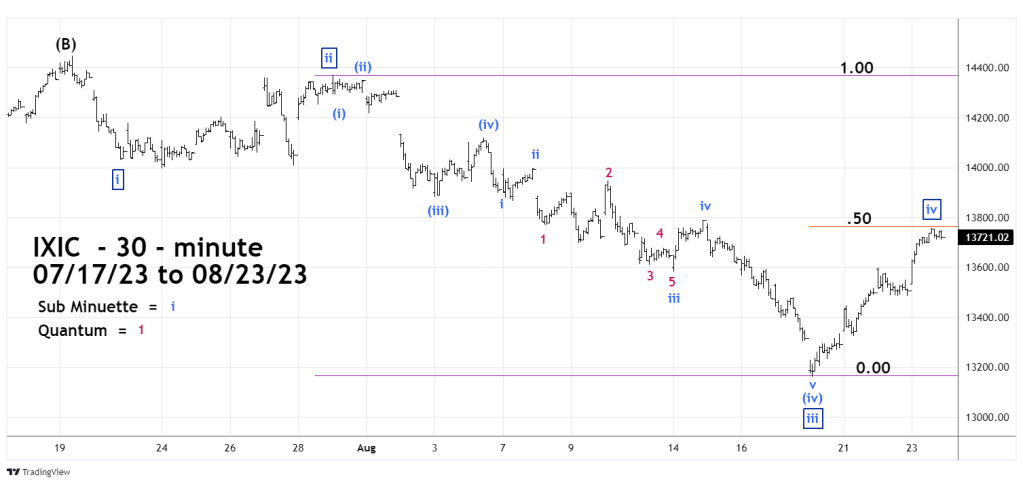
On 08/23/23 IXIC reached a Fibonacci .50 retracement of the presumed Minute wave “3” down and the area of the peak made on 08/14/23. These two factors imply a short -term top may have been made.
