The Nasdaq Composite (IXIC) and Bitcoin in U.S. dollars (BTCUSD) tend to trend together. Since late 2021 BTCUSD has been the weaker of the two and could be giving a preview of near -term IXIC action.
The weekly BTCUSD and IXIC chart courtesy of Trading View shows their relationship since November 2021.
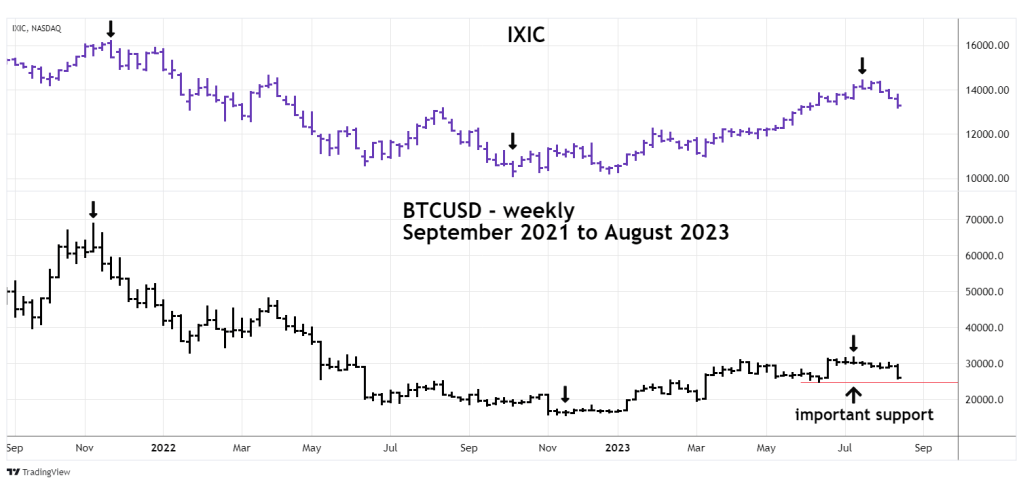
BTCUSD made its all-time high in November 2021 two weeks before the IXIC all-time high.
After nearly a year of decline IXIC bottomed out about a month before BTCUSD.
During their 2023 rally BTCUSD retraced about 30% of it prior bear phase while IXIC retraced about 70% of its 2021 to 2022 decline.
In July 2023 BTCUSD peaked one week before IXIC, and in the subsequent drop BTCUSD is weaker than IXIC.
There’s BTCUSD chart support at 24,762.70. A break below this level could open the door to the next chart support around 20,000. If the relationship continues, IXIC could correspondingly drop to the 12,000 area.
Watch BTCUSD 24,762.70.
