Today 07/26/23 the U.S. FOMC raised short-term interest rates by 25 basis points from 5.25% to 5.50%. This increases the temptation of stock fund managers to sell a portion of their stock holdings and get a nearly risk-free return.
It’s possible this behavior has been occurring for several weeks which may explain why several S&P 500 – sectors have been underperforming the S&P 500 (SPX). Please see the 07/16/23 blog “S&P 500 – Sector Analysis”.
External momentum oscillators indicate the SPX rally is slowing. The daily SPX chart courtesy of BigCharts.com illustrates what’s been happening since mid – June 2023.
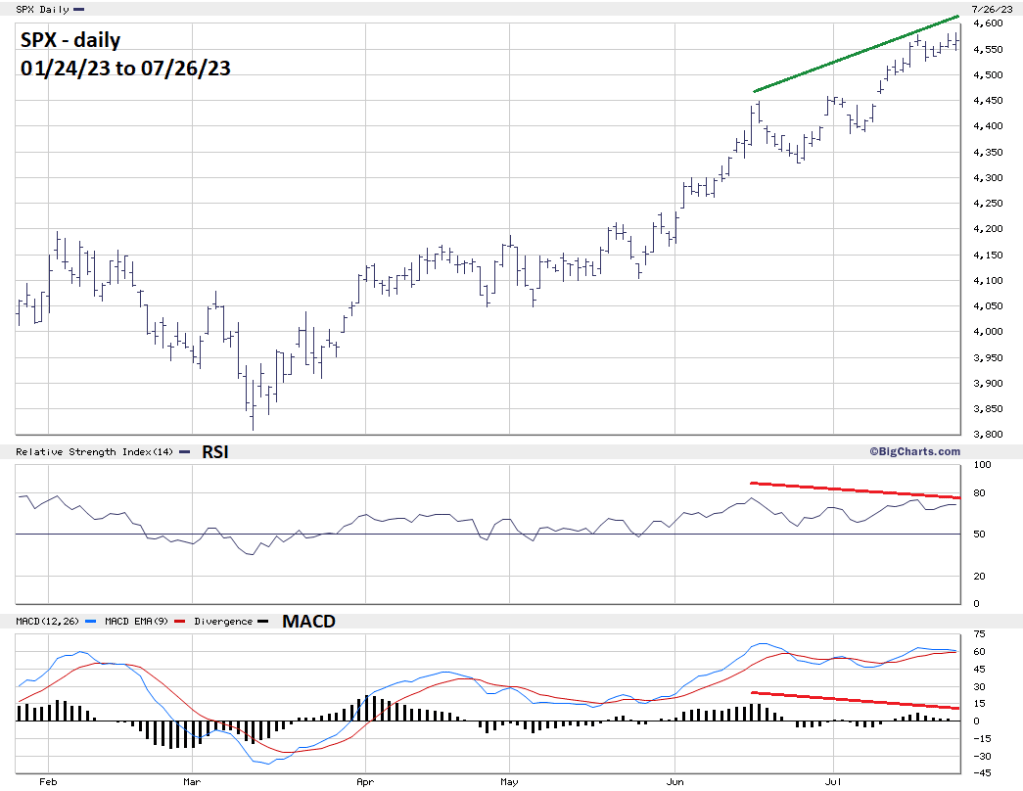
Daily RSI has a double bearish divergence. The MACD – Histogram has a significant bearish divergence.
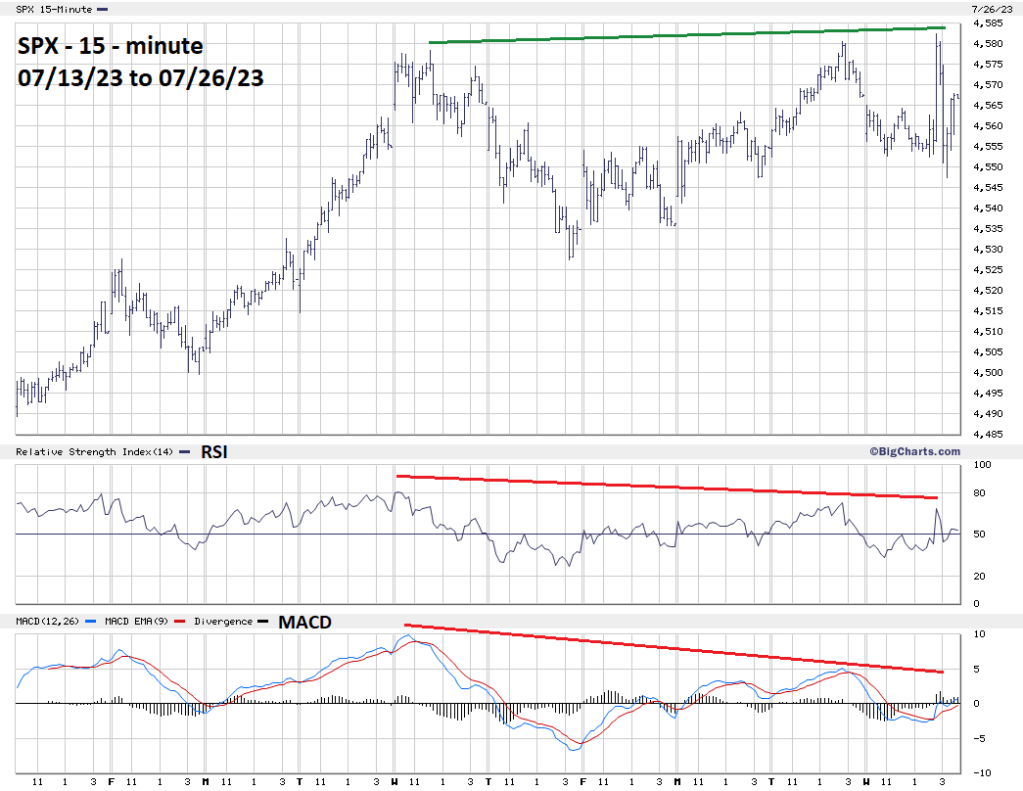
The 15 – minute SPX chart shows the same phenomenon on a shorter time scale.
Also, of interest the Dow Jones Industrial Average as of 07/26/23 has recorded advances thirteen – days in a row – which hasn’t happened since 1987. Did anything bearish happen in 1987? Yes, two months after that prior 13 – day winning streak there was a global stock market crash.
