Occasionally significant S&P 500 (SPX) tops have occurred in July. During the past 25 – years there have been five instances of SPX important July peaks. These prior July tops provide fascinating clues to a potential SPX 2023 high.
First a review of the potential time cycle turn that was due late June to early July 2023. These were illustrated in the following blogs.
“Potential Spiral Calendar Turn Due – June 2023” – 06/24/23.
“Potential Fibonacci Time Ratio Turn Due – June 2023” – 06/25/23.
“Mind Blowing Fibonacci Relationship” – 07/03/23.
The main U.S. stock indices have moved beyond the leeway time for each of the cycle turns, invalidating all three potential cycles.
All of nature is subject to cycles. The mass human mind is unique because we can think and reason. Unlike birds that can migrate to the same location at the same time each year, we can decide differently. When a market time cycle is invalidated it opens the door for the next potential time cycle turn. After an invalidated time cycle the next potential turn could occur months or several weeks later. Sometimes the next cycle could happen in just a few weeks.
The monthly SPX chart courtesy of Trading View illustrates each of the five important July tops since 1998.

After the 07/20/98 SPX top there was a 21% decline that ended in October 1998.
After the 07/19/98 SPX peak the decline was 13% ending in October 1999.
The 07/22/07 high was the penultimate top of a five-year bull market. The subsequent correction was 11%. The ultimate peak in October 2007 was only 1% above the July high. What followed the October 2007 high was a seventeen-month bear market.
The 07/21/11 high was the tertiary peak of a one – year bull phase. After the July 2011 high, the SPX fell 20% and bottomed out in October 2011.
The 07/20/15 high was the second peak of a double top. The first top was on 05/20/15 at SPX 2,134.72. The 07/20/15 top was 2,132.82. The subsequent bear move fell 15% and ended in February 2016.
Also fascinating is a potential Fibonacci equality time cycle – eight years from July 2007 to July 2015, followed by another eight – years into July 2023.
Supporting the long -term July 20th cycle theory is a potential short-term time cycle.
The daily Dow Jones Industrial Average (DJI) chart show another possible Fibonacci equality time cycle.
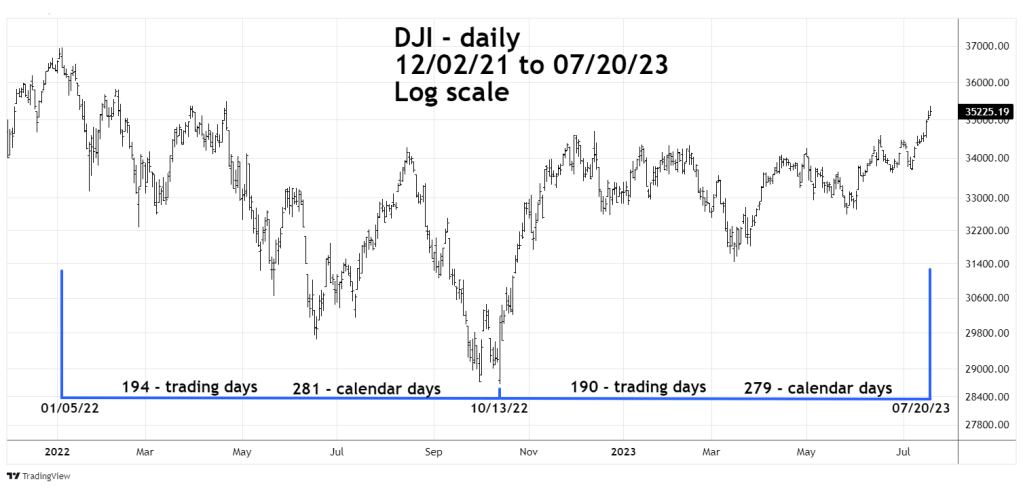
Today 07/20/23 the DJI was the only one of the three main U.S. stock indices to make a new post October 2022 rally high. Note the January to October 2022 decline is nearly equal to the October 2022 to July rally.
It’s possible that a significant U.S. stock market top could be in place as of 07/20/23.
The next blog will examine supporting evidence from the dimensions of sentiment and momentum.
