As the S&P 500 makes new post October 2022 rally highs the VIX remains above its most recent bottom made on 06/22/23.
The daily VIX chart courtesy of Trading View updates its action.
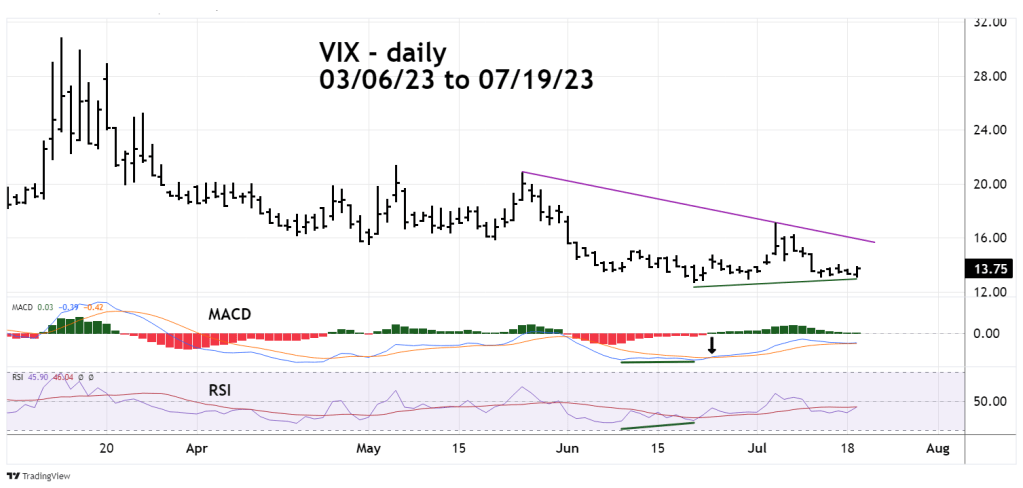
The VIX failing to make a new low with the SPX making new rally highs is a potential topping signal for U.S. stocks. Also note the bullish MACD and RSI bullish divergences at the VIX 06/22/23 bottom. MACD had a bullish lines cross over on 06/26/23 and the lines remain in a bullish trend. Clarification – the reference to “bullish” with the VIX implies bearishness for stocks.
On 07/19/23 all three main U.S. stock indices: S&P 500, Dow Jones Industrial Average, and Nasdaq Composite made new post October 2023 rally highs. This signals the rally in U.S. stocks, at least for the near-term could continue.
