Recent blogs on this website have illustrated three amazing time cycle each pointing to a significant turn for U.S. stocks – late June/early July 2023. On 06/30/23 the S&P 500 (SPX) made a new post October 2022 rally high unaccompanied by either the Dow Jones Industrial Average, or the Nasdaq Composite. This broad bearish momentum divergence at a time cycle turn strongly implies a significant top could be in place. The SPX long-term Elliott wave count could give us clues to what may develop in the coming months and years.
For an explanation of the very long-term Elliott wave count from the beginning of the U.S. stock market since the year 1790, please see the first blog of this website “The Big Picture” – August 2020. Also please see the blog “Long – Term Forecast to the Year 2043” – August 2020. That blog illustrated the presumed Cycle wave “I” up from the March 2009 bottom could take a three-wave form – the first wave of a decades long Ending Diagonal Triangle. It now appears more likely that Cycle wave “I” if complete, was an Elliott Impulse wave. The termination date for the presumed Super Cycle wave (V) of 2043 is still possible.
The monthly SPX chart courtesy of Trading View illustrates the Elliott wave count from March 2009.

The Presumed Cycle wave “I” lasted a Fibonacci 13 – years. Corrective waves of the same degree are proportionate both in price and time to the prior impulse wave. Therefore, we assume that Cycle wave “II” could continue for several years.
The longest U.S. stock bear market since the early twentieth century was the Dow Jones Industrial Average 1937 to 1942 decline. A Fibonacci 5 -years. All other U.S. stock bear markets lasted from 1 to 3 years. Elliott wave guidelines for alternation says to expect something different. A – 5 – year move down from top to bottom is also proportionate to the prior 13 – year bull market, 5/13 is .382 a Fibonacci ratio. Of course, the bear market could last longer than 5 – years. Japan’s Nikkei 225 probably holds the world record for the longest stock bear market, 1990 to 2008 – 18 – years!
The weekly SPX chart examines the action since 2019.
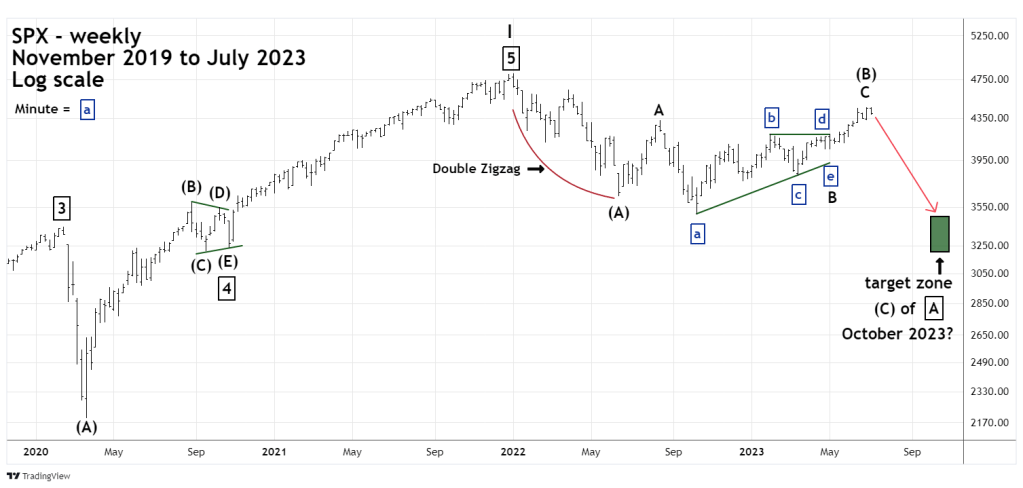
The first phase of the decline after the January 2022 peak took the form of a Double Zigzag. Using the guideline for alternation the next decline could be something different, perhaps a Single Zigzag? This ties in with seasonal patterns which are bearish into October. The presumed Intermediate wave (A) decline lasted about five and a half months. The presumed intermediate wave (C) could be faster, lasting perhaps three and a half months?
The price target zone from 3,250 to 3,470 is based primarily on the area of the October 2020 correction. This target zone will be examined later in more detail assuming the SPX drop from 06/30/23 continues.
One final note, the potential October 2023 bottom target is labeled as Primary wave “A” – boxed. This means any new bear market bottom made in 2023 could be just the first phase of an even larger developing bear market.
If this forecast develops it could be a hard time for the buy and hold crowd.

II wanted to take a moment to express my sincere appreciation for your outstanding article. Your work truly stands out as a testament to your expertise and dedication in delivering high-quality content.
The article you wrote is not only informative, but it is also meticulously backed by numbers and data, which adds a tremendous amount of credibility to your arguments. It’s refreshing to see an author who takes the time and effort to provide concrete evidence and support for their claims.
Beyond the factual support, your article is an engaging and enjoyable read. The way you present the information is clear, concise, and well-structured, making it easy to follow along and absorb the knowledge you’re sharing. It’s evident that you put a lot of thought into organizing your ideas and ensuring a seamless reading experience.
I must commend you on the depth of insights your articles offer. There is so much to learn from your research and analysis. Overall, your articles are an exceptional piece of work. It not only educates but also inspires readers to delve further into the subject matter. Your commitment to delivering high-quality content is evident in every aspect of your writing. I am grateful for the effort you put into creating such a valuable resource.
Regarding the SP500 topic, I concur and have opted to take a short position. Additionally, have you observed two noteworthy occurrences:
– There is a 93% probability that the FED will raise rates by 25 basis points.
– Something noteworthy took place in the SP500 mini options market last week, although I haven’t had the opportunity to analyze it thoroughly yet.
LikeLike
Thanks very much for the compliments.
LikeLike