The national stock index with the clearest Elliot wave pattern since October 2022 has been the UK 100 (UKX). The following list of blogs chronicles the UKX amazing progress.
The 03/13/23 blog “Major UK 100 Top is Probably in Place” noted “On 02/16/23 the UK 100 reached 8,047, this could be a major top!”
The 04/02/23 blog “Britannia Rules the Elliott Waves” noted that after 02/16/23 “The decline was in a five- wave impulse which implies it’s the first wave down of a larger developing drop.”
The 04/23/23 blog “UK 100 at Sell Point? – 04/21/23” illustrated that the UK 100 had reached an area of chart resistance and a possible secondary peak.
The 05/11/23 blog “UK 100 Rollover” noted the UK 100 could decline to the 7,200 to 7,300 area.
On 07/06/23 the UKX reached the 7,200 to 7,300 area.
The daily UKX chart courtesy of Trading View updates its progress.
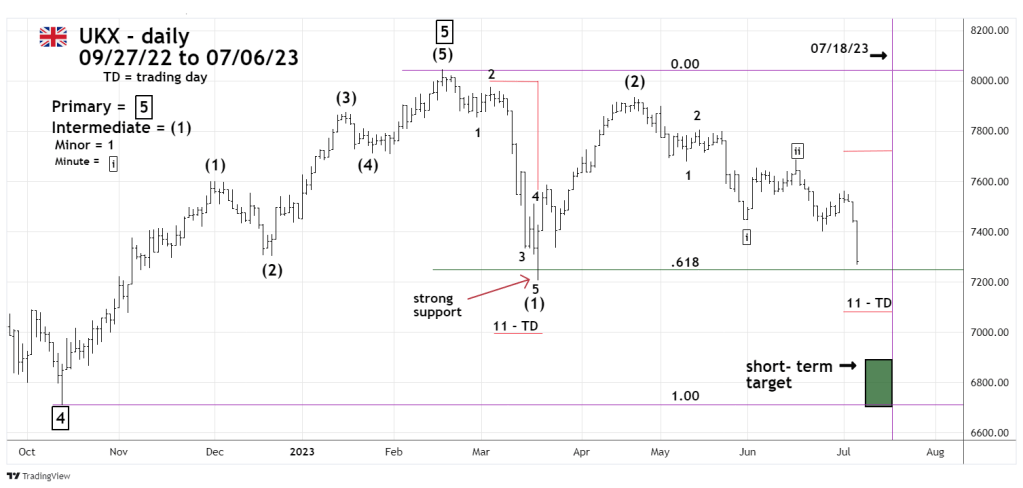
The UKX 03/20/23 bottom at 7,206.82 was close to a Fibonacci .618 retrace of the October 2022 to February 2023 rally. The chart bottom and retracement area is strong support requiring a powerful move down to make a decisive break.
It appears the UKX currently could be in an Elliott wave – third of a third down. This is the most powerful and dynamic Elliott wave structure, and what would be required to break strong support.
A clue to how fast a strong move down could occur comes from the 03/02/23 to 03/20/23 decline which was 11 – trading days. Adding 11 – trading days to the most recent short -term on 07/03/23 targets 07/18/23 as a possible short-term bottom.
If the UKX reaches the short – term price target zone in July 2023, its possible later in 2023 for a break below the October 2022 bottom. Such a move could open the door for significantly lower UKX prices.
