On 06/30/23 the S&P 500 (SPX) made a new post October 2022 rally high. Time cycles indicate a potential top late June to early July 2023. U.S. stocks could be on the verge of an important summit.
The 06/27/23 blog “Start of the Final Rally?” noted “The end of the second quarter is 06/30/23, there’s a good chance for portfolio “window dressing”. This occurs when portfolio and fund managers try to boost reported performance before publishing required reports. Typically, a fund manager will sell stocks that have underperformed and replace them with stocks that have performed well.”
The gap up of all three main U.S. stock indices on 06/30/23 was a classic example of “window dressing”. Additionally, the 06/27/23 blog noted the SPX price target zone was 4,450 to 4,480, the SPX high on 06/30/23 was 4,458.48.
The weight of momentum evidence supports the theory U.S. stocks could be forming a major top. The daily SPX chart courtesy of Trading View illustrates two bearish momentum divergences.
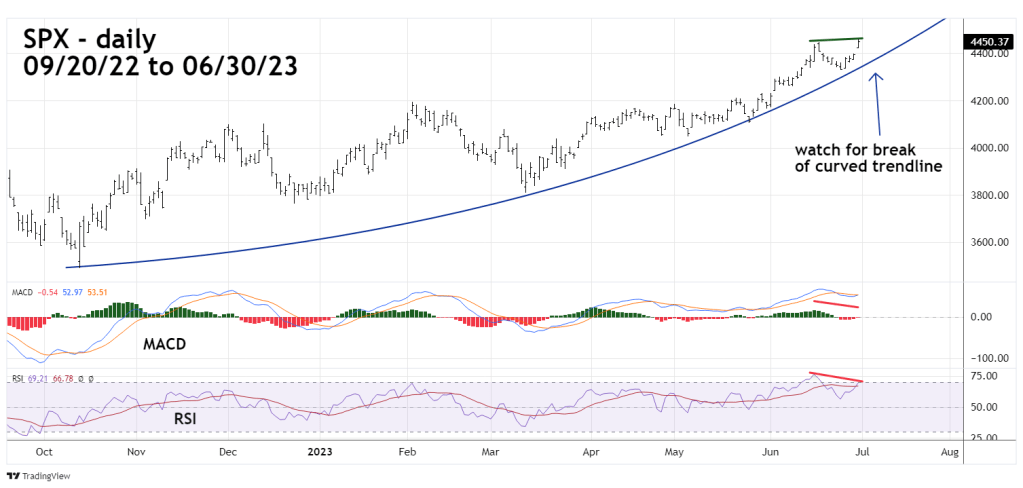
At the SPX 06/16/23 peak both daily MACD and RSI confirmed the SPX rally high which is typically a bullish signal for stock indices. The bearish divergences of both oscillators on 06/30/23 indicates momentum is weakening. Also watch the curving trendline from October 2023. A move beyond this line could signal the development of a significant drop.
The daily SPX, Dow Jones Industrial Average (DJI), and Nasdaq Composite (IXIC) chart illustrates the relationship between the three main U.S. stock indices.

On 06/30/23 only the SPX made a new post October 2022 rally high, what I call a “Rule of the majority” signal. This occurs when only one of the three main U.S stock indices makes a new rally high or new decline low unaccompanied by the other two indices. The truth is with the non-confirming indices signaling a trend change.
The next daily chart courtesy of StockCharts.com illustrates the S&P 500 Bullish Percent Index ($BPSPX).

Bullish Percent Index is a breadth indicator based on the number of stocks on Point & Figure Buy Signals within an index.
Typically, there could be several Bullish Percent Index bearish divergences before a significant stock market top occurs. This chart shows two of the three bearish divergence off of the $BPSPX high in August 2022.
The 06/18/23 blog “S&P 500 Topping Zones noted using RSI in conjunction with the Bullish Percent Indicator to determine stock index peaks.
RSI readings above 70% are in the overbought zone. On 06/30/23 the $BPSPX – RSI went above 70%. The 06/18/23 blog noted that the topping zone range indicated by RSI could be between 8 and 15 trading days. There was an RSI topping range between 06/14/23 and 06/22/23 then RSI went below 70%. It’s possible the presumed zone range of 8 to 15 trading days is splitting into two zones.
The next daily chart courtesy of Barchart.com shows the NYSE new 52 – week highs ($MAHN).

Previously NYSE new 52 – week highs had a significant bearish divergence vs. the February 2023 reading. Now they’ve blasted above the February 2023 reading – a potentially bullish signal. Watch the daily RSI and MACD, if their current divergence are invalidated it could shift the balance of the momentum evidence to bullish. An invalidation of the current bearish “rule of the majority” signal could also tip the scale in favor of the bulls.
The next blog will examine the weight of evidence from the sentiment dimension.
