The FTSE Vietnam 30 Stock Index (VN30) has reached and moved down from potentially powerful resistance. This could be additional evidence that the next wave down of a global stock bear market may have begun.
Fibonacci retracement points are like magnets for price. After price reaches a Fibonacci level its frequently becomes a barrier.
In terms of support/resistance, one Fibonacci coordinate is like a wooded wall. Two Fibonacci coordinates close together can have the strength of a brick wall. When three Fibonacci coordinates are near each other it could be equivalent to a steel wall.
Within the last few trading days VN30 has reached and moved down from a cluster of three Fibonacci coordinates.
The weekly VN30 chart courtesy of Trading View illustrates its Elliott wave count from its November 2021 top.
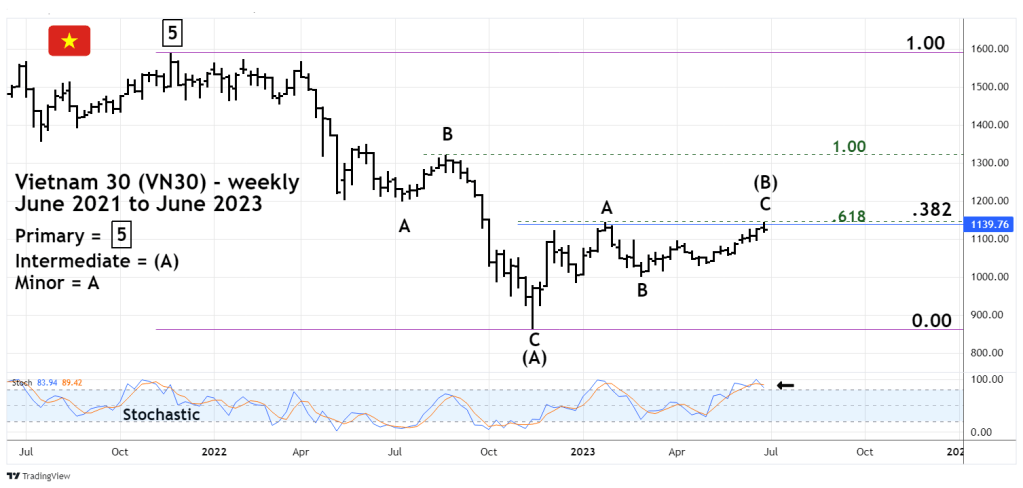
The decline from November 2021 to November 2022 can be counted as an Elliott wave Single Zigzag. The rally from November 2022 to June 2023 counts best as a Double Zigzag. For the sake of clarity this rally is illustrated as a Single Zigzag.
The three Fibonacci coordinates are as follows.
The primary coordinate measures the length of the November 2021 to November 2022 decline.
The VN30 top November 2021 was 1,587.00 minus 863.31 – the November 2022 bottom is 723.69. Multiplied by .382 is 276.45 added to 863.31 targets 1,139.76. The June 2023 high is 1,143.53 a difference of 3.77 points.
The secondary Fibonacci coordinate measures the length of the August to November 2022 drop – labeled as Minor wave “C” of Intermediate wave (A). The length is 456.85 points multiplied by .618 yields 282.33, added to 863.31 targets 1,145.64 only 2.12 points above the June 2023 high.
The tertiary Fibonacci coordinate measures the November 2022 to January 2023 rally – labeled Minor wave “A” of Intermediate wave (B). The length is 278.77 points multiplied by .50 equals 139.38 points, added to the February 2023 bottom – Minor wave “B” at 1,001.05 targets 1,140.43. Just 3.10 points from the June 2023 high.
Three Fibonacci coordinates in proximity is rare and represent potentially powerful resistance. If the resistance holds there’s a very good chance VN30 could decline at least back to its November 2022 bottom.
