In early April and early June, Saudi Arabia announced Crude Oil production cuts. In both instances price rallies were brief. From the perspective of supply and demand, if supply is reduced price should rise – unless there’s a decrease in demand. The inability of Crude Oil to have a sustained rally implies global economic weakness that could be the prelude to a global recession.
The daily continuous Crude Oil futures chart (CL2!) courtesy of Trading View illustrates its action from the bull market top in March 2022.

If at the end of March 2023 someone knew with 100% certainty of two coming production cuts, they could have gone heavily long Crude Oil futures. As of the end of June the knowledgeable Oil bull would have a losing position.
Crude Oil is seasonally bullish until the end of August, this might be the reason Crude Oil price has not collapsed. In the near term its possible there could be a rally back to the low 80.00 area. This bullish oil factor may not result in a rally for U.S. stocks. After the major U.S. stock bull market peak in October 2007, Crude Oil continued to rally into June 2008. After the all-time high in U.S stocks – January 2022, Crude Oil continued to climb into March 2022.
Assuming Crude Oil is in a still developing bear market, the hourly Point & Figure chart illustrates downside targets.
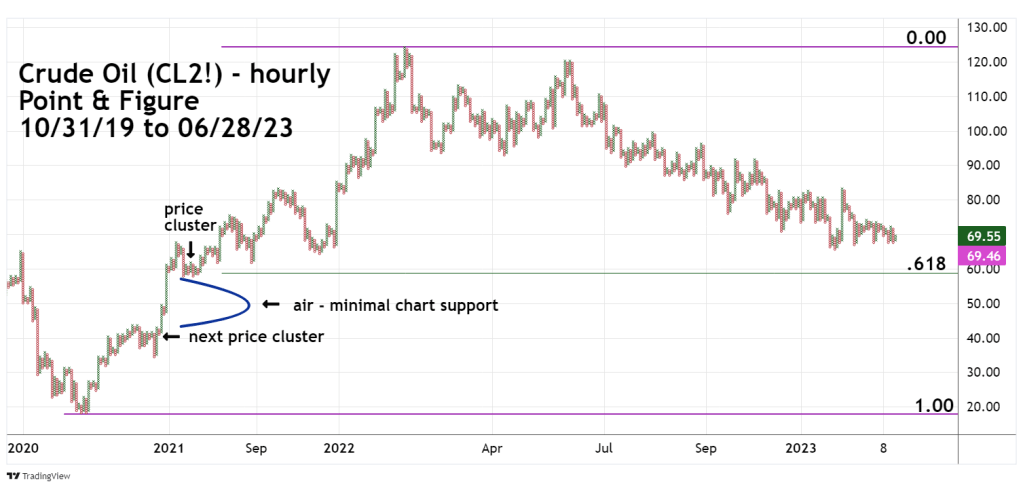
A Fibonacci .618 retracement of the April 2020 to March 2022 bull market is at 59.00, and in price cluster zone from 58.00 to 60.00. If this strong support fails to hold, Crude Oil could plunge lower. Below 58.00 there is no significant chart support, opening the door for a move down to the 41.00 area.
