The prior blog detailed a potential Spiral Calendar turn date for U.S. stocks in June 2023. Using a different methodology and two different U.S. stock market peaks also reveal a potential turn due in June 2023.
U.S. stocks in late 2018 were in a significant decline, which appeared particularly ominous because it was occurring during seasonally bullish months of November and December. By mid – December 2018 it looked like the S&P 500 (SPX) could decline at least 20% from its prior bull market top. Was this just the beginning of a larger developing bear market, or a correction within an ongoing bull market?
I researched the SPX history to see if there was a 20% correction within a bull market and found the SPX – July to October 1998 decline. This bear move was about 22% and the most fascinating part was that the 2018 decline, going into late December 2018 was approaching the same number of trading days as the 1998 drop. Sometimes markets can make significant turns on the cusp of a new year. This factor plus the price and time similarities of the two bear moves hinted at a significant bottom near the end of 2018 or the beginning of 2019.
The SPX 2018 bear move terminated on 12/26/18 the decline was about 20% from the bull market peak in September 2018.
Please see my December 2018 posts on tradingview.com for additional information about this discovery. My tradingview.com username is markrivest. The history of my posts can be found on my profile page in the “ideas” section.
The possibility that the current U.S. stock bull move could terminate near mid-year prompted me to reexamine the SPX July 1998 top. While examining the monthly SPX chart it looked like there could be a Fibonacci time ratio with the September 2018 peak. Which could be significant since the declines after these tops were nearly identical.
There is a Fibonacci time ratio relationship with the SPX 1998 and 2018 peaks illustrated in the monthly SPX chart courtesy of Trading View.
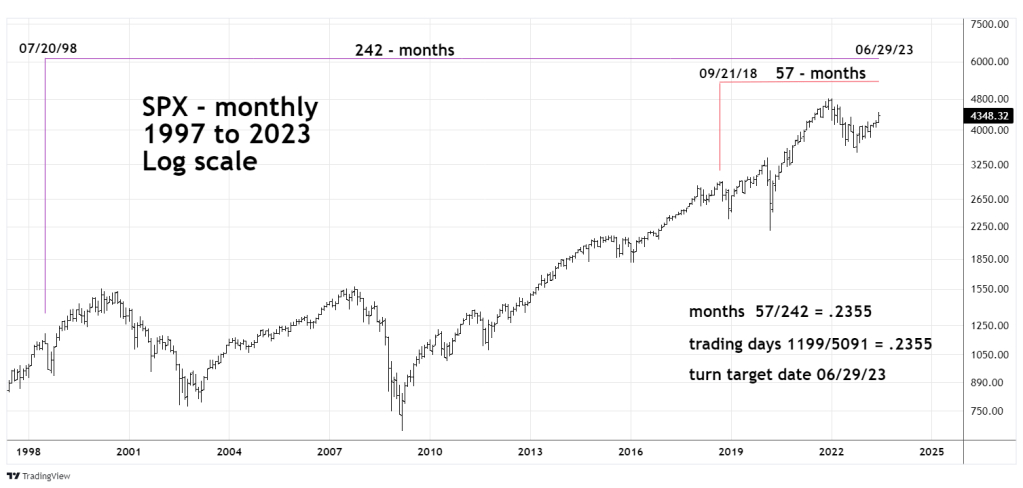
The monthly time ratio is .2355 which is very close to the Fibonacci ratio of .236. Going down to the daily scale targets 06/29/23 as the bullseye date for a potential SPX turn.
What is even more amazing is that this Fibonacci time ratio is not in the Spiral Calendar time sequence. The 1998-to-2018-time frame is not a Spiral calendar time length, and neither is the 2018 to 2023 time period.
In Spiral Calendar analysis, market tops/bottoms align with lunar cycle Basic Fibonacci time analysis only requires market tops and bottoms. Two different time analysis methods yielding the same result – potential turn late June 2023, is a significant clue.
If the SPX rallies this week it could set up a fantastic shorting opportunity.
