Christopher Carolan’s 1992 book “The Spiral Calendar” explains how he discovered and developed a method of forecasting market turns using lunar cycles. Chapter 10 of the book is called “Future Forecasts” and illustrates how the Spiral Calendar could pinpoint market turns years or even decades into the futures. One of those forecasts – made in 1992 is due late June 2023.
Carolan’s discovery began with an examination of the Dow Jones Industrial Average (DJI) crashes in 1929 and 1987. He saw that between May and October of both years the DJI had two tops and two bottoms that were near the same date but not precise. The differences on a solar calendar ranged from 8 to 11 calendar days. When examining the October 19, 1987 crash bottom with the October 29, 1929 on a lunar calendar they matched up perfectly! The other bottom was made in May of both years and the two tops also matched precisely.
Carolan then measured the number of moons between the 1929 top and the 1987 top which was 717 moons. He thought that 717 could be a permutation of a Fibonacci number. He took the 29th Fibonacci sequence number of 514,229 and calculated its square root which is 717!
From that data he was able to construct the Spiral Calendar. The calendar is Logarithmic, each sequence is designated with the letter “F” and the sequence number.
The following is an abbreviated version of the calendar showing the calendar sequence number, the Fibonacci sequence number, the number of moons, and days.
Calendar Fibonacci Moons Days
F- 1 1 1 29.5
F- 2 1 1 29.5
F-3 2 1.41 41.8
F-4 3 1.73 51.1
F-5 5 2.24 66.0
F-6 8 2.83 83.5
F-7 13 3.61 106.5
Jumping ahead to the 15th calendar sequence is as follows.
F-15 610 24.7 729.4 or 2.0 – years
F-16 987 31.42 927.7 or 2.5 – years
F-17 1597 39.96 1,180.1 or 3.2 – years
The calendar extends to the 39th sequence which is 643 – years.
To find a potential Spiral Calendar turn date, take a sequence, for example F-17 and add the days after a significant market top/bottom. Next take a lower sequence number, for example F-15 and add the days after a top/bottom that’s closer to the present. If both projected Spiral Calendar dates are within 3 days of each other it’s a potential Spiral Calendar turn date. Spiral Calendar turns do not have to occur on a new or full moon.
The monthly DJI chart courtesy of Trading View is a reproduction of the June 2023 forecast illustrated in Chapter 10 of “The Spiral Calendar.”
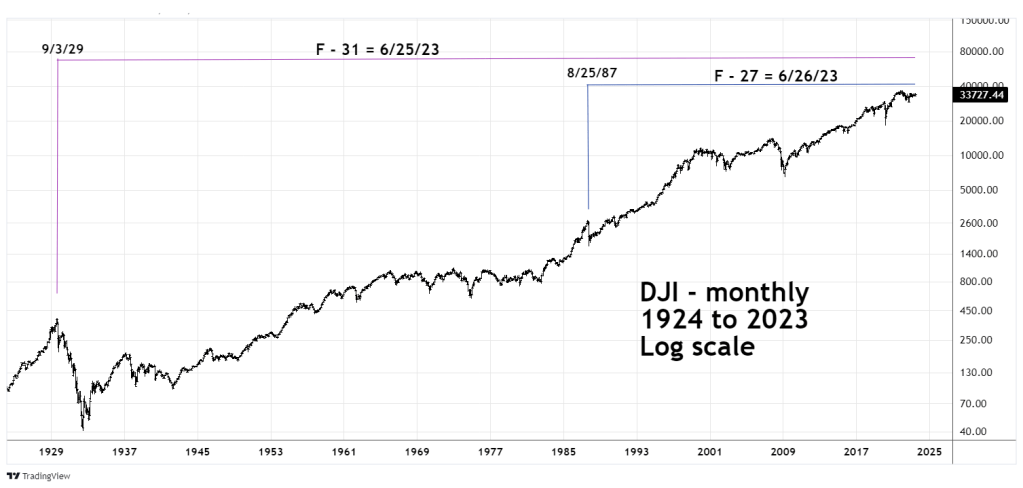
The F-31 sequence is 93.8 years and targets Sunday June 25, 2023.
The F-27 sequence is 35.8 years and targets Monday June 26, 2023.
Note the Fibonacci relationship between the sequences 35.8/93.8 = .381 a Fibonacci ratio.
Carolan stated that because the coordinates came from two important tops, June 2023 would likely be a top.
Carolan used a leeway of plus or minus 5 – trading days from a Spiral Calendar target date. There was no DJI trading on June 19, 2023 because of a U.S. holiday. Five trading days before June 25, 2023 targets June 16, 2023 which is the S&P 500 post October 2022 rally high ,so it’s possible a Spiral Calendar top is already in place. If not, the forward leeway after June 26, 2023 extends to July 3, 2023.
The daily DJI chart shows where a potential rally could target in the next five trading days.

With the Spiral Calendar method, it’s not necessary for a market to make a new high/low for a turn to occur. The DJI June 16th peak while lower than the December 13, 2022 top could be the Spiral Calendar turn. The DJI projected move above the December 13th peak is the most likely Elliott wave scenario.
The Spiral Calendar method is perhaps the most precise tool to discovering potential market turns. The percentage of effectiveness is on the low side.
Chapter 10 of the “Spiral Calendar” has five long -term DJI forecasts, three of which have already occurred. They are as follows.
October 19, 1995 – ineffective.
July 27, 1998 – effective, primary DJI peak was 5 – trading days before the Spiral Calendar date.
October 1, 2004 – effective in only catching the final wave down of a decline that began in early 2004. The decline after October 1st lasted until October 25, 2004 falling only 5%. Also, coming in early October may have mislead analysts/traders into believing a crash could be imminent – it wasn’t.
While its performance has been mediocre, the methods incredible long – term precision definitely deserves our attention.
We could have an answer to the Spiral Calendars effectiveness in the next 5 – trading days. If there’s a rally it could set up a fantastic shorting opportunity.
Recommended Reading: Carolan, Christopher [1992] The Spiral Calendar, New Classics Library.
