On 06/21/23 the S&P 500 (SPX) declined .52% while the Advance/Decline was almost flat. Today 06/22/23 the SPX was up .37% while the NYSE Advanced/Decline line was 2.3 to 1 in favor of declining stocks.
The hourly chart courtesy of Trading View illustrates the short-term action.
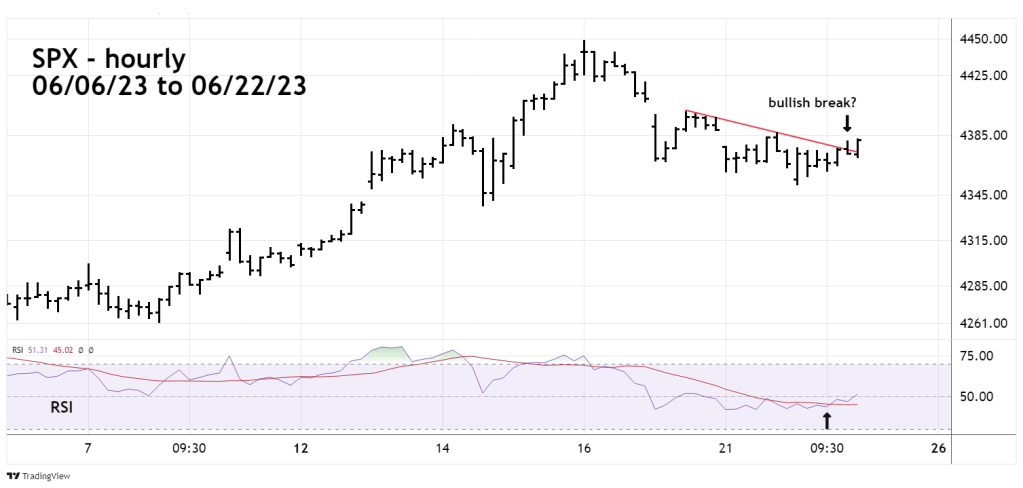
The SPX failed to reach the target support zone in the 4,330 area, keeping the hourly RSI from getting into the oversold zone below 30%.
There was a bullish RSI crossover of its moving average line, and the SPX broke above a short-term declining trendline. The bearish A/D line offsets these two bullish factors opening the possibility for a drop down to the 4,330 area.
We could have an answer to the near-term SPX direction on 06/23/23. If the SPX made a short-term bottom on 06/2/23 it increases the chances of what could be an important time cycle top at the end of June 2023.
This potential time cycle top will be detailed in a blog this weekend.
