From 05/25/23 to 06/16/23 the S&P 500 (SPX) was in a strong and steady rally. Corrections of these rallies are usually short and shallow. The crowd recognizes the trend and are eager to buy a decline. Those holding long are reluctant to sell. The drop from the 06/16/23 peak could be shallow.
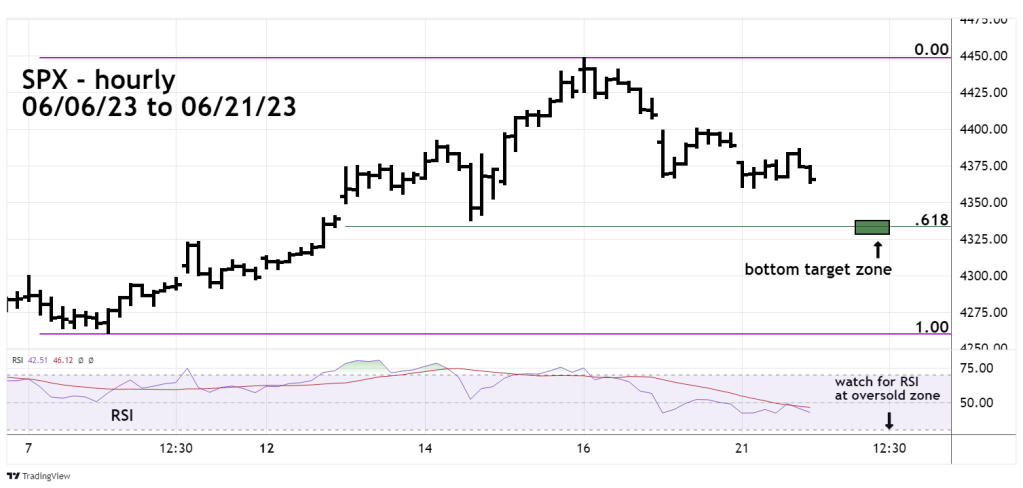
The hourly SPX chart courtesy of Trading View illustrates recent action.
On 06/21/23 NYSE declining stocks were only slightly larger than advancing stocks.
At the end of the 06/21/23 session the performance of the three main U.S. stock indices were:
Nasdaq composite -1.21%.
S&P 500 -.52%.
Dow Jones Industrial Average – .30%.
It’s curious that the Russell 2000 (RUT), which is composed of small cap stocks, was only down.
.20%. If the drop from 06/16/23 was the prelude to a deep decline, small caps stocks would likely lead the way down.
The SPX could bottom in the 4,330 area near 06/14/23 chart support.
If hourly RSI reaches 30% – the beginning of the oversold zone – it could signal a bottom.
The next near-term bottom could set the stage for a termination rally to the SPX 4,500 area.
