In bull market rallies stock indices trend together. Making new highs at about the same time and declining together. Moves up during large bear markets tend to be more erratic.
A comparison of the post October 2022 U.S. stock market rally with a prior bullish phase reveals some interesting insights.
The U.S. stock rally that began on 10/13/22 has as of 06/02/23 lasted 159 – trading days. If this move up is presumably a new bull market its performance should match that of prior bull markets.
The U.S. stock bull market that began in March 2020 came after a crash and fueled by liquidity from the U.S. Federal Reserve. This triggered a very dynamic rally. To get a view of a more standard stock bull market, the up phase that began in December 2018 provides a good example.
The daily S&P 500 (SPX), Russell 2000 (RUT), and Consumer Staples Sector (XLP) chart courtesy of Trading View illustrates the action from 2018 to 2019.

The RUT is composed of small – cap stocks which tend to underperform the SPX during economic weakness.
The XLP has the stocks of some of the largest and most stable U.S. companies, such as Procter & Gamble and Pepsi. This index will sometimes outperform the SPX.
All three indices bottomed out on 12/26/18, adding 159 – trading days targets 08/14/19 at the end of the comparison period.
From December 2018 to May 2019 all three trended up together. Then in May a correction began. Note that in mid- May the XLP made a new high. In early June both the SPX and XLP made new rally highs – this is a bullish “rule of the majority” signal. By August 2019 at the end of the comparison period, all three were in a corrective phase.
Months later in November 2019 all three indices were making new bull market highs.
The next SPX, RUT, and XLP chart examines the bull phase after mid – October 2022.
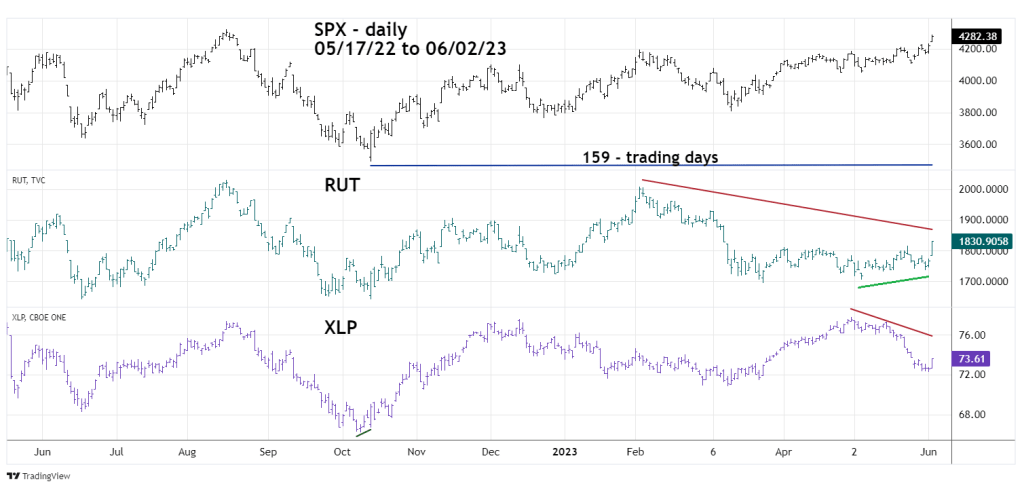
Note that the XLP bottomed out on 10/07/22 while the SPX and RUT ultimate lows were on 10/13/22.
As of 06/02/23 both the RUT and XLP had significant bearish divergences vs. the SPX. What’s most amazing is that XLP made a new decline low on 06/01/23, while the RUT was not only above its 05/31/23 low it was also above its 05/04/23 bottom! An index that can sometimes be more bullish than the SPX is now more bearish than an index of small – cap stocks!
At the end of 2019 all three indices were making new bull phase highs. Could all three indices make a new bull phase high later in 2023? Yes, anything can happen but is it likely? Market analysis focuses on probabilities not certainties. The XLP 2019 mid-May high and its early bottom in October 2022 were clues that momentum may favor the bulls.
The shocking evidence that XLP made a short-term low after the RUT is a powerful clue that momentum may favor the bears.
There is considerable risk holding or entering long positions on most U.S. stocks.
