The US stock market and Crude Oil – West Texas Intermediate (WTI) have similar seasonal patterns, specifically both tend to trend down from September to October. Crude Oil’s powerful move up from its late September 2022 bottom could continue through October and perhaps longer. This counter seasonal move up could be a hint for a near-term rally in US stocks.
The daily chart of Crude Oil – WTI futures (Continuous: Next Contract in Front) courtesy of Trading View – symbol CL2! illustrates near-term action.
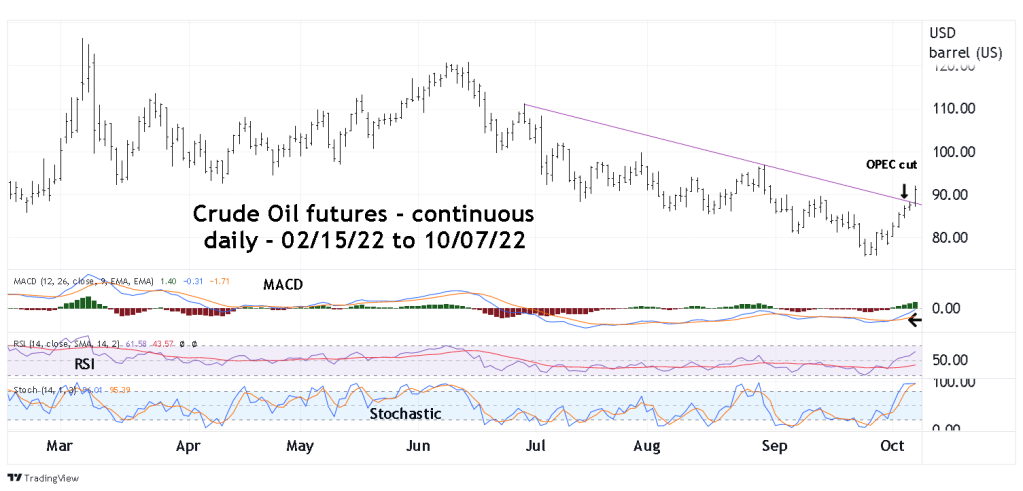
On 10/05/22 OPEC announced a production cut. Note that CL2! made its bottom on 09/26/22 more than a week before the announcement This appears to be a case where perhaps well-informed money knew what was coming and bought before the fact. This is just a guess.
As to why there’s a Crude Oil production cut, let’s examine it from a broad generic supply and demand perspective.
You are the producer of commodity “X”, and it appears the economy is weakening causing less demand for the commodity. To avoid or slow a price decline you reduce the supply. If the analysis of the economy is correct, the price of commodity “X” could stabilize with small moves up and down. If the economy is weaker than analyzed, the price of commodity “X” could decline or continue falling. If the price of commodity “X” rises after a supply reduction it hints that perhaps there’s at least near-term economic strength.
Since its late September 2022 bottom CL2! is up over 21%. On 10/07/22 when the S&P 500 (SPX) fell 2.8% CL2! climbed 4.2%.
Daily MACD has a bullish lines crossover and has yet to move above the “zero” level. RSI has a bullish cross of its moving average line and has yet to reach the overbought zone. Daily Stochastic has reached the overbought zone, however this sensitive indicator could remain overbought for several days, even weeks.
Price has broken above a multi-month declining trendline. Also note the steady and steep rise since the late September 2022 bottom. This appears to be an Elliott Impulse wave which implies a bullish trend.
Evidence on the daily scale indicates price could continue rising for at least several weeks.
The weekly SPX and CL2! chart illustrates their relationship.

Roughly both the SPX and Crude Oil – WTI trend together. The red lines show the seasonal September to October bearish zones. In 2018 Crude Oil – WTI topped in early October, both bottomed in December. The major divergences occurred in 2020 when Crude Oil bottomed in April a month after the SPX crash low. And in 2022 Crude Oil – WTI continued to rally into March, two months after the SPX peak.
The next CL2! chart focuses on weekly momentum.

Weekly Stochastic has a bullish lines crossover and RSI has crossed above its weekly moving average line. So far there is no bullish MACD signal. The weight of evidence from the three momentum indicators implies Crude Oil – WTI could continue to rally for several weeks.
Powerful counter seasonal moves are usually hints that a market could be overcoming seasonal factors. The powerful move up in Crude Oil – WTI, with momentum implying more upside actions suggests a move up during the remainder of the bearish season.
The most likely scenario in the coming weeks could have Crude Oil – WTI reaching or exceeding its March 2022 top. The SPX could rally but peak before Crude Oil – WTI, reaching or exceeding its August 2022 intermediate peak.
