Today 08/16/21 the S&P 500 (SPX) and Dow Jones Industrial Average continued their up trends by making new all-time highs. Several internal momentum indicators continued their down trends.
The NYSE – New 52 – Week Highs ($NYHGH) chart courtesy of StockCharts.com illustrates one of the momentum indicators.
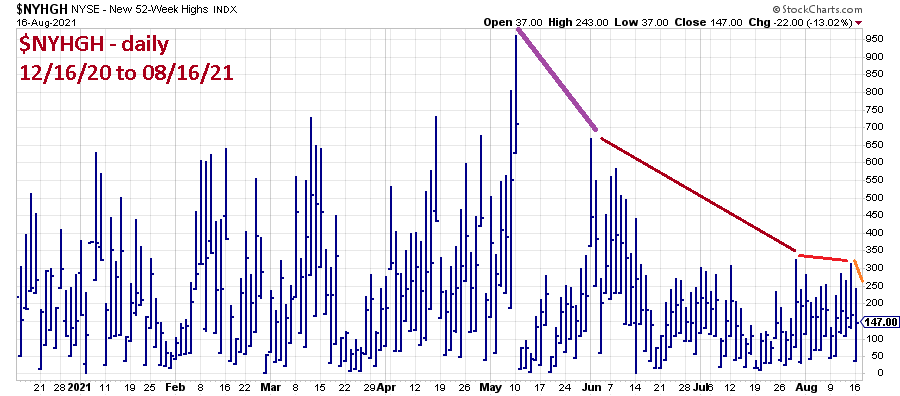
The simultaneous up trend with a diminishing number of new 52-week highs is unsustainable. The US stock market is at high risk of a mini crash.
Today traders were stopped out of 50% of a short position when the SPX moved above 4470.00. The 100% short position of non-leveraged SPX related funds began on the SPX open 07/12/21. The total move up from the entry point was 2.2%, the loss on the 50% position was 1.1%. Continue holding short the remaining 50% position with a stop loss on an SPX move above 4510.00.
