The S&P 500 (SPX) rally from the 03/23/20 bottom to 12/11/20 does not appear to be a developing Elliott five-wave Impulse pattern, nor does it appear to be an Elliott Wave – Ending Diagonal Triangle. The most likely current wave count is that an Elliott Wave – Horizontal Triangle may have formed from 02/19/20 to 10/30/20. The subsequent move up from the 10/30/20 bottom is probably a developing Primary wave “5” – boxed. If so, when completed it will mark the completion of the entire SPX secular bull market from the major bottom made in March 2009.
The following weekly SPX chart courtesy of Trading View illustrates the entire secular bull market from the March 2009 bottom.

The supposed Primary wave “4” – boxed retrace .504 of the supposed Primary wave “3” – boxed. While this is large for a wave four retracement, the near bullseye .50 – Fibonacci retracement provides credibility to the wave count.
Another interesting Fibonacci aspect is that the widest part of the 2018 decline – Minor wave “A” of Intermediate wave (4) is .494 of the February to March 2020 decline.
There are other interesting Fibonacci relationships within the entire wave count 2009 to 2020. Elliott Wave students should study the structure to gain additional knowledge of Elliott wave theory.
The next chart shows the daily SPX count from 2017.
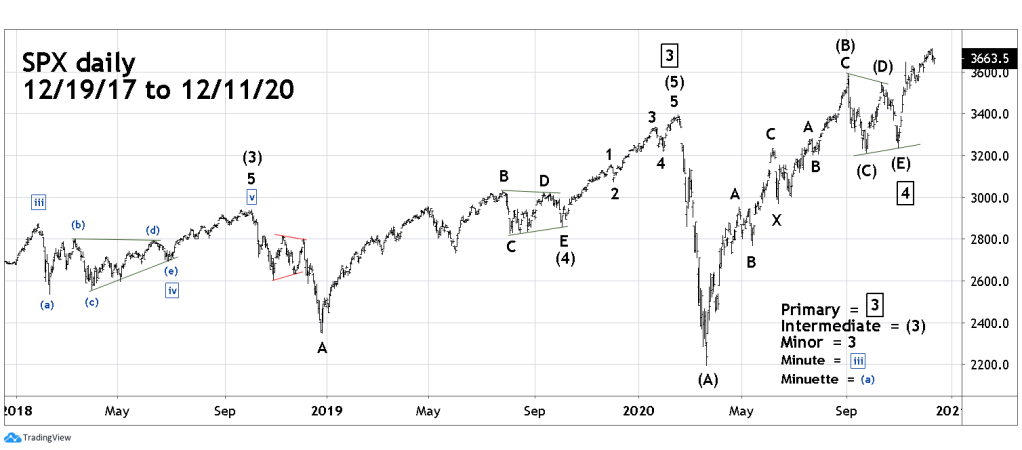
It’s fascinating that the SPX peaks in 2018 and early 2020 appear to have also been preceded by Elliott Wave – Horizontal Triangles. The main features of Horizontal Triangles is that they are net sideways corrections. They only appear in the wave “four” position of motive waves and in wave “B” of corrective patterns. Each sub wave of a Horizontal Triangle, waves “A” through “E” sub divide into three waves or a combination of three waves.
Note that the supposed Intermediate wave (B) rally from the March 2020 bottom counts as a Double Zigzag. So far, the entire structure from 03/23/20 to 12/11/20 can not be counted as either an Impulse wave or Ending Diagonal Triangle. While subsequent action could turn the structure into either an Impulse wave or an Ending Diagonal Triangle, the probability is incredibly low.
The most important point on the SPX chart is the 10/30/20 bottom at 3233.90. A break below this level implies the supposed Primary wave “5” is complete. A move below SPX 3233.90 could indicate the beginning of a multi-year bear market. In the near-term the SPX most likely will continue to rise into at least early January 2021.
On 11/02/20 this website recommended investors and traders to buy SPX related non leveraged funds at the open of SPX trading 11/03/20. Continue holding long SPX funds.

Thanks, Mark, for advising us to hold onto SPY. Would you consider this current market to be in “Santa Claus rally” mode?
LikeLike
Santa Claus rally is a term used by the financial media, my guess is that they came up with the name because seasonally US stock continue to rise from November until at least the new year. I view the possibility of US stocks rising in December as part of the larger seasonal pattern. An upbeat mood because of the holidays could be a contributing factor to rising stock prices. Yes, a move up in December can be view as a Santa Claus rally.
LikeLike